Home energy consumption
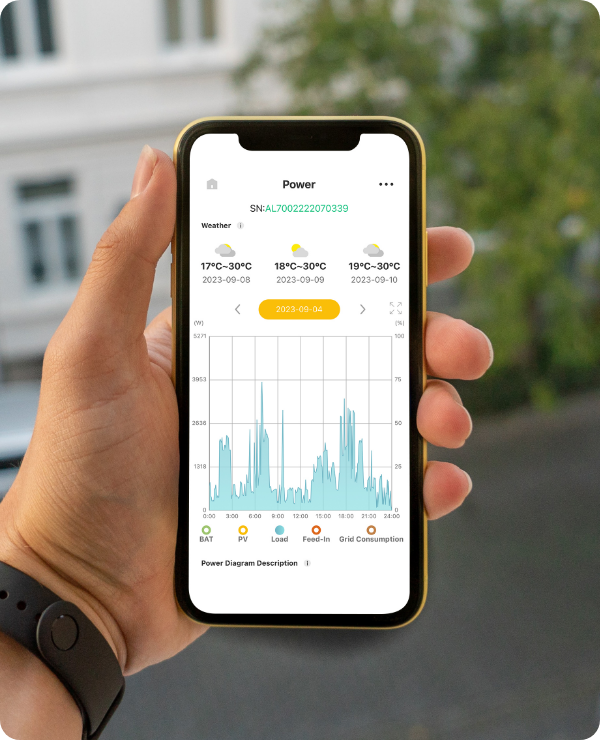
In our first diagram, we can see the home consumption over a 24-hour period starting from midnight on the left to 11.59pm on the right. The power used for the home fluctuates depending on what is being consumed. This may include lights, TV’s on stand-by, the Electric Car being charged, the washing machine running and of course, the Electric Storage System (ESS) being charged.
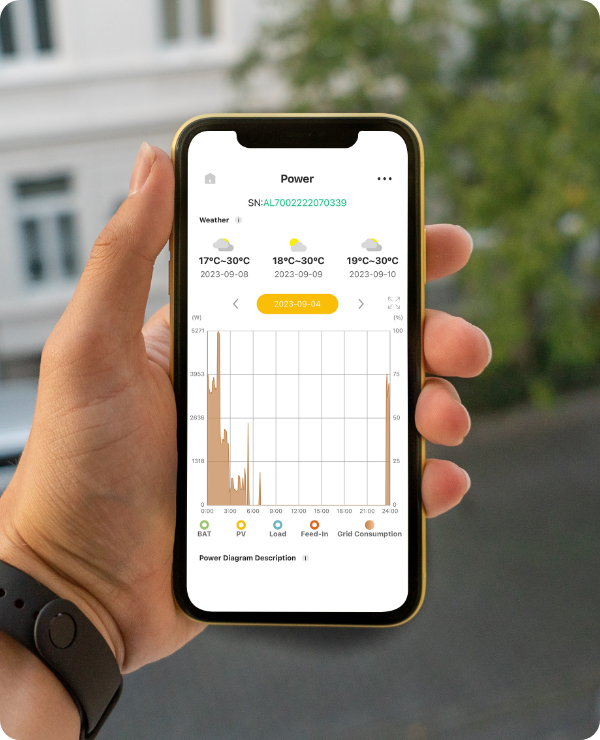
Energy consumed from the national grid
In our second diagram, you can now see the energy consumed from the national grid. In this instance the client has a low-cost Octopus Energy night-time tariff so uses the low-cost energy to charge the Electric Vehicle (EV) and top up the Alpha Battery plus supplying the home’s basic electrical consumption.
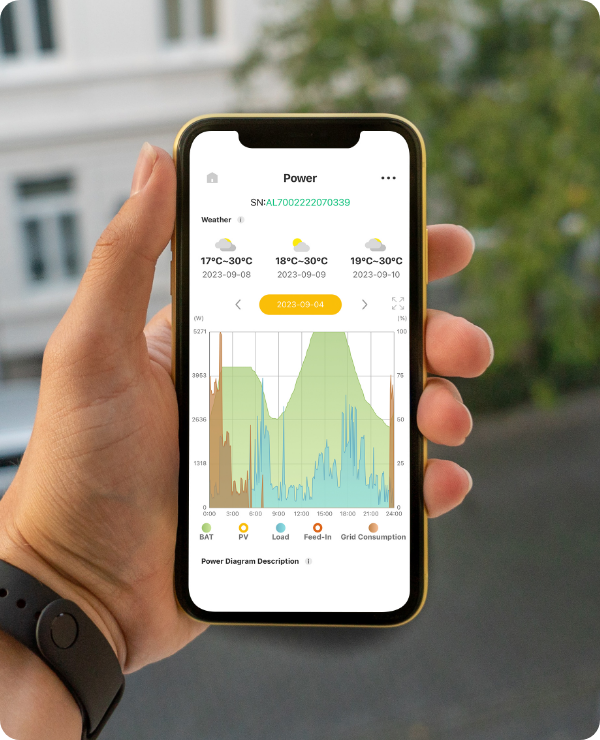
Once we overlap the home consumption, grid consumption and the battery consumption we start to understand the correlation between them. You will note that the battery is only charged to 80% initially. That’s because we have to factor in the solar gain to complete the picture.
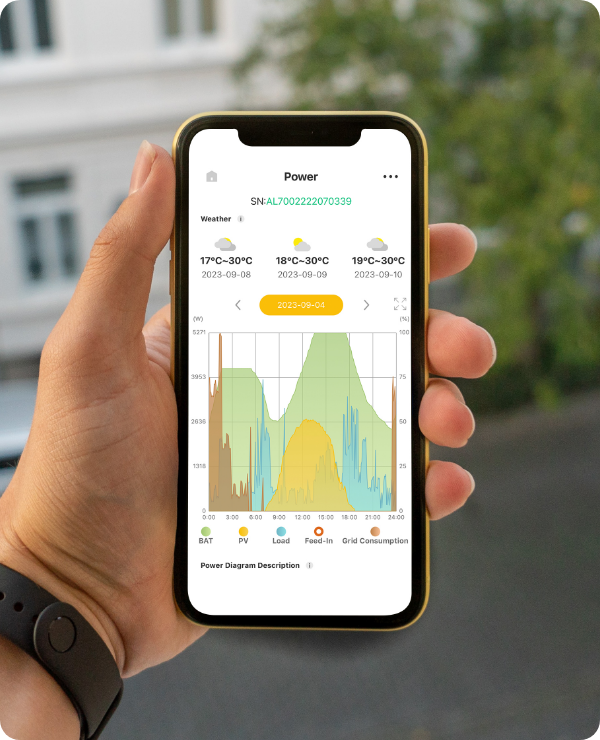
With solar gain now included in the diagram, we can understand the relationship between all elements. Whilst the battery charge was limited to 80% during the off-peak hours it only discharged to around 50% before the solar gain began to start charging the battery again whilst simultaneously providing the home with the power it required. As the day progresses the solar gain begins to drop off and the now fully charged battery discharges to fulfill the home’s consumption requirements.
At 10.30pm when the off-peak tariff is available, the battery automatically starts to re-charge and so the daily cycle continues.
Most importantly, home consumption during the hours of 5.30am and 10.30pm are from the solar and battery installation rather than the grid saving the client from paying the high tariff costs during peak hours.
To find out more about how you can make cost-saving changes to your energy usage in your home or business, call 0800 644 6750 or email [email protected]
